Tuur Demeester is an economist and investor focused on personal and financial freedom and bitcoin, and editor in chief at Adamant Research.
With all the commotion in the market, now is an interesting moment to take a step back and look at some price patterns. I think especially the price behavior of China versus US/EU can be instructive to assess what to expect from the markets going forward.
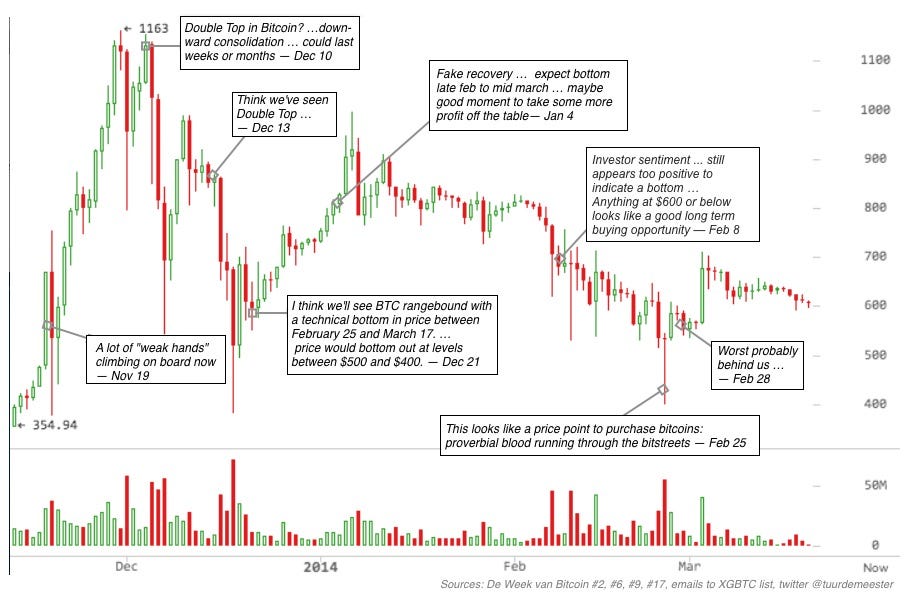
Back in December, based on two previous cycles in bitcoin, I projected a bottom between late February and mid March, from the peak of $1,150 to between $400 and $500. On 24th February, following the Mt. Gox closure news, we saw a panic sale during which the price dropped to $400 on Bitstamp. From then on I’ve suspected the bottom was in, or at least close:

My thoughts on the bitcoin price over time
Indeed the price recovered, to as high as $705 on 2nd March, yet after that it declined again to a low of $382. The question now is whether this period of mid-April is giving shape to a final bottom, or whether it is just another down leg in a trend towards a retest of the $260 April 2013 high, or an even further decline.
The chart below shows the bitcoin price at Bitstamp. Yesterday it briefly dropped below the 17th December support levels to $382, only to bounce back above it today. The close of today will tell us more about whether this level has enough bids under it to support it:

Will bitcoin stay above the technical support of $382?
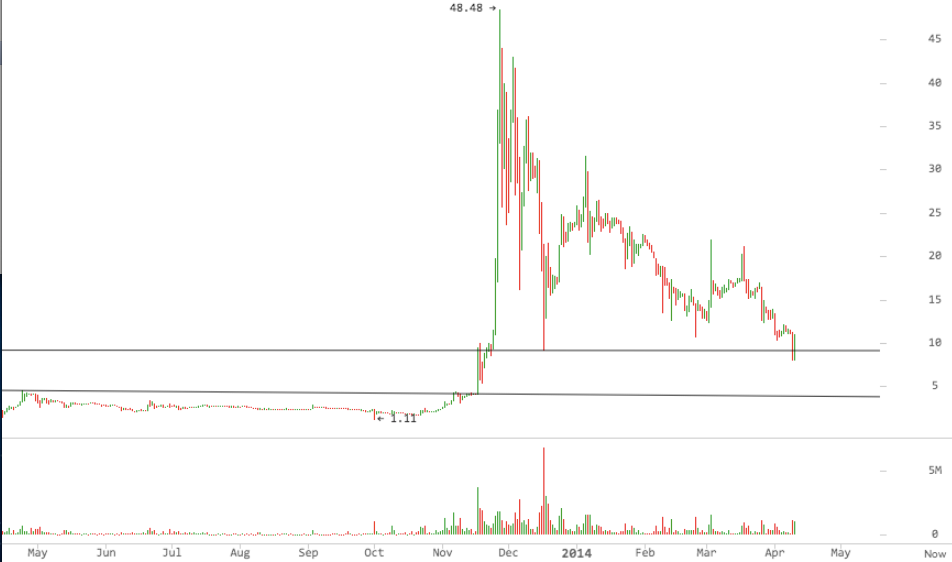
If we look at litecoin, we see a similar pattern, with technical support at $9.10 briefly violated:

Litecoin bulls and bears are also in a fight over the $10 support/resistance level.
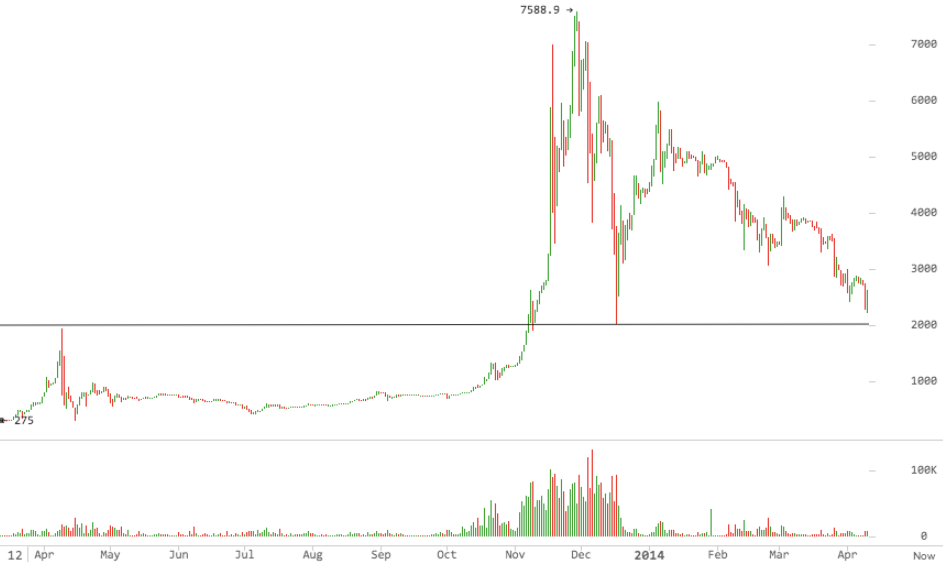
Here’s the BTC/CNY situation in China, where the technical support level lies lower, at the USD equivalent of $325:

CNY 2000 ($325) is support for China
So China seems to suggest that we are heading lower. But how influential are the Chinese markets for the global bitcoin price?
Judging from the price action of the past few months, it definitely seems like China and US/Europe each have their own internal dynamic. Let’s crunch some numbers (scroll down for the graphs):
Please Note: For what follows, I’ll be using BTC China as proxy for China*, and Bitstamp as proxy for US/Europe. To make the spreads more apparent, I’ve converted CNY to USD using the historical converter on oanda.com. For China, the first leg of the rally arguably started on 1st November, from $203. The rally then became supercharged on 16th November, from $453, and peaked on 29th November at $1,237. From then we saw a quick crash down to $623.50 on 6th December, and another down to $329 on 17th December.
On 5th January, we completed a false recovery to $977.70, only to fall back to a low of $498 on 24th February. The most recent low of 2nd April was the equivalent of $392. For US/EU, the first leg of the rally arguably started on 1st November, from USD 201. The rally then became supercharged on 16th November, from USD 434, and peaked on 29th November, at USD 1163.
From then we saw a quick crash down to USD 543 on 6th December, and another down to USD382 on 17th December. On 5th January, we completed a false recovery to $995, only to fall back to the low of $400 on 24th February. On 2nd April, we touched $416. I’ve summarized these findings in a couple of graphs below. We see that China’s price extremes were, indeed, more extreme:

Trading in China has been more volatile
The rallies in China were significantly stronger (total rally in CNY from the start on 7th July was a 19x move, vs a 17x move for the western markets):

Stronger rallies…
The declines in price were somewhat similar, with December being the outlier for China:

… and stronger declines
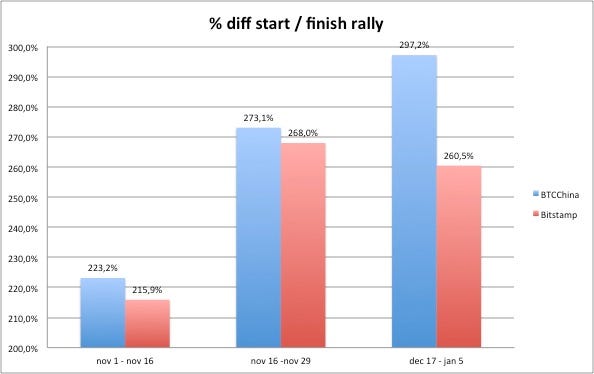
I think the different price behavior in China vs US/Europe shows how the Chinese market is a bit more immature, hence the higher volatility. The most interesting datapoints for me are the spreads:

Spreads communicate which market is pushing the prices up or down
In November, China was the locomotive of the rally, pulling the prices higher in the US/EU as well. Then in late December, regulatory panic ensued in China, which explains why the sell off there pulled prices lower than elsewhere. The recovery was orderly, resulting in a small spread early January.
The collapse of Mt. Gox affected US/EU psychology to a much greater extent than that of China, which is why on February 24 prices went +20% deeper in the West.
Interestingly, despite the latest bearish news from China, the spread is now positive, meaning that the Chinese are willing to pay more for a Bitcoin than we are. This could be a sign that we are underestimating the resourcefulness of Chinese buyers in converting yuan into bitcoin going forward.
Let’s take a look at some other fundamentals to try and see whether there is support for a +/-$400 price in the markets. Here is the weighted bull/bear ratio from the r/bitcoinmarkets subreddit (now 14,000 traders).

Source: Coinsight
Interesting how traders there were as bearish on 17th December as they were before the entire rally in late September. Current levels are moving consistently higher but far from bubble territory. Looking at the order book of the largest USD exchange Bitstamp (+/- 30% of USD exchange volume):

Sellers are in the market for liquidating 25,000 BTC, and buyers have put less than $7m on the line to scoop them up – the lowest level since the crash of 17th-18th December. This is a sign of pessimism, ie could be a contrarian buy signal (graph is from yesterday). Over to the margin traders on Bitfinex:

The blue line represents the daily interest rate for borrowing dollars on the platform. We can clearly see how the market got overheated by late December.
Right now we can see how it is quite cheap to borrow dollars there (0.095%), but the interest rate is still higher than during the Mt. Gox collapse (0,068%) and also higher than the low of the 1st January crash (0.087%).
Conclusion
A retest of the $260 April high would form a strong bottom for a new rally to be built on – a drop below $350 will likely lead us there – but based on the data above (and the strong signs that Wall Street is getting ready to move in), I suspect that if it happens, such a drop would be short lived.
I’m still not convinced prices will dwindle significantly lower than the $380 levels. With likely troubles ahead for the Western stock markets, and with that also the legacy banks and governments, I expect wind in the sails for hard money by summer or fall.
Finally, I encourage readers to take this analysis for what it is: a very rough estimate based on available historical data. I see these analyses as exercises to prepare myself psychologically for what could be ahead. Personally, I don’t trade with more than 2-3% of my bitcoin holdings.
Knock on wood: so far this strategy has helped me dodge quite a number of bullets in this exciting Wild West of Money.

